Bluetooth to solve traffic problems


Aarhus, Denmark’s second-largest city is using Bluetooth sensors to collect traffic information, based on the movement of road users’ mobile devices. The BlipTrack sensors, placed on the entire road network, including adjacent highways, provides the city with both real-time and historic traffic information, including driving times, speed, dwell times and flow.
Besides the benefits of real-time reporting, which enables the city to gain insight and understanding of current road density, flow and formation of queues, and share traffic information with road users on signs, the historical data is now being used to detect driving time anomalies. Effectively, this means that the city can pinpoint road sections and intersections where driving times deviate from the norm as a result of construction projects, incidents, roadwork, faulty traffic lights and other factors.
“The benefits we have gained from the solution since implementation are very significant,” said Asbjørn Halskov-Sørensen, ITS Project Manager at Aarhus Municipality. “We now discover errors and irregularities that we would not have a chance to see otherwise. In addition, it is extremely educational and easy to study how the incidents of various kinds influence the road network.”
The data provides a comparison of current and typical driving times, minute-by-minute, throughout the day. The typical driving times, which are continuously updated, are based on various types of days (weekdays, weekend, bank holidays) and time of day.
If driving times deviate from the typical, the system automatically raises a flag. As the system logs and visualises all deviations, traffic engineers can create historical performance and reliability reports based on deviations from the norm. The city is provided with an overview of the current situation and tendencies over time, to initiate countermeasures.
“BlipTrack data is generally used for much more than just being able to measure the effect of signal optimisation and roadwork/construction projects, but this is clearly an important part of its application,” added Halskov-Sørensen. “Ultimately, the data contributes to an improved economy and a better environment through reduced driving times and fuel consumption, and thus reductions in greenhouse gas emissions from vehicles.”
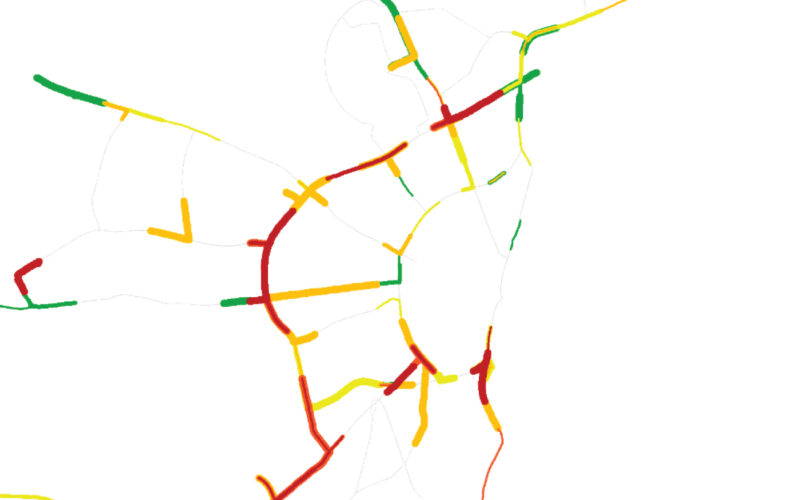
Alarm visualisation can be displayed in various ways; for example, over time and for each road section, based on intersection errors, or the impact of a major traffic accident. It can show the scattering effect that can cause both a deterioration and improvement of driving times, depending on what alternative routes motorists choose to take advantage of, or if road users are prevented from reaching parts of roads.